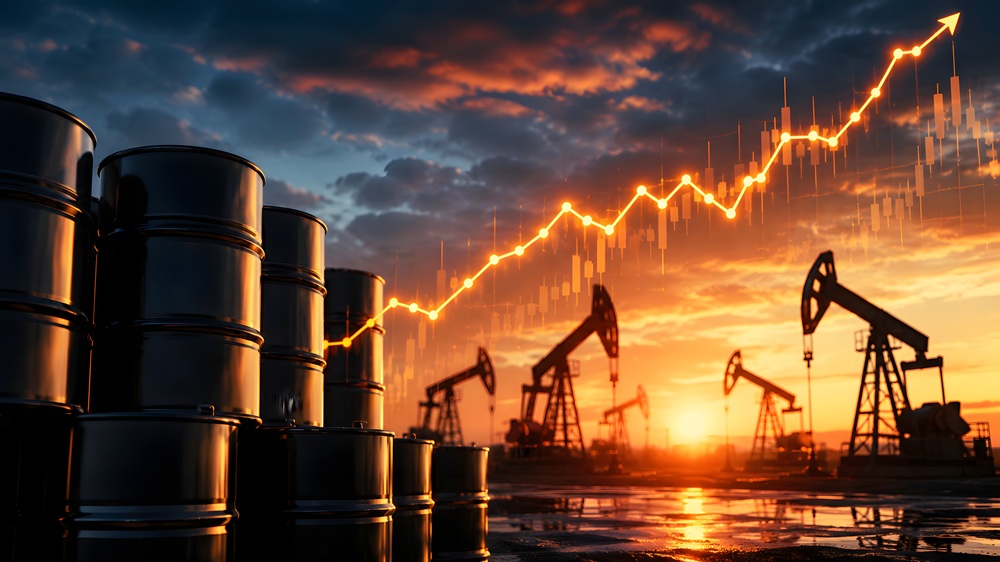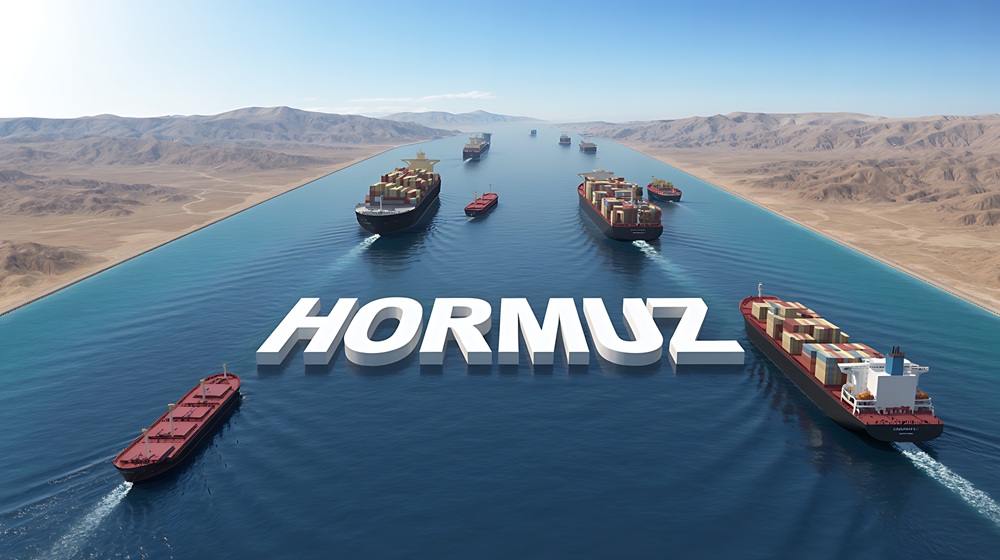
4月8日宣布的停火以及围绕45天休战的平行讨论并未解决霍尔木兹海峡的混乱问题。目前,他们已经限制了最坏的情况,但油轮运输量仍处于正常水平的一小部分,伊朗对过境费的需求预示着结构性转变,而不是暂时的转变。
最初的地区冲突已成为全球能源冲击,市场面临的问题不再是霍尔木兹是否受到干扰,而是这种混乱对石油的最低定价产生了多大的永久性影响。
关键要点
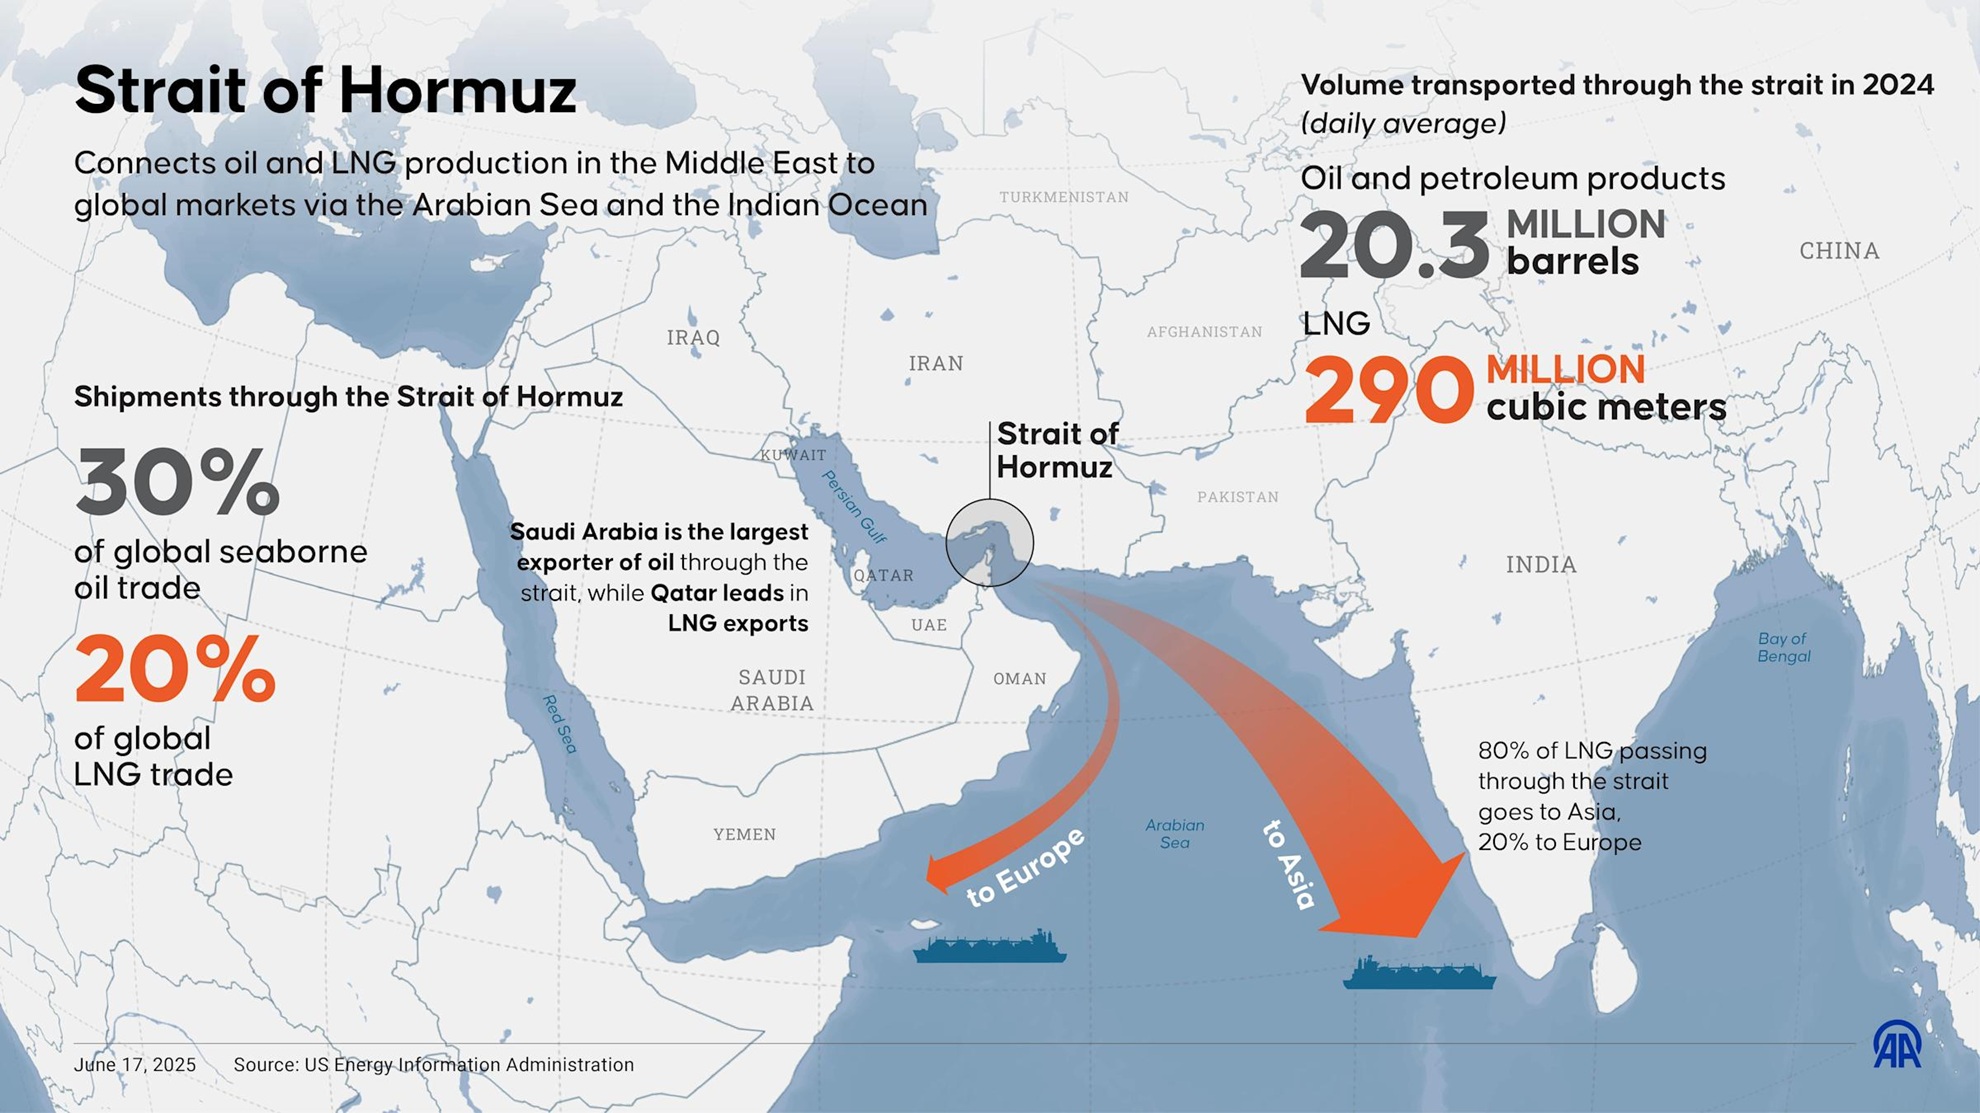
- 每天约有2000万桶(桶)的石油和石油产品通常通过伊朗和阿曼之间的霍尔木兹海峡,相当于全球石油消费量的约五分之一,约占全球海运石油贸易的30%。
- 这是流量冲击,不是库存问题。石油市场依赖于持续的吞吐量,而不是静态存储。
- 如果中断持续超过几周,布伦特原油可能会从短期飙升转向更广泛的价格冲击,存在滞胀风险。
- 穿越海峡的油轮运输量从每天约135艘下降到中断高峰期的不到15艘船只,减少了约85%,超过150艘船只停泊、改道或延误。
- 4月8日宣布了为期两周的停火,为期45天的休战谈判正在进行之中。伊朗已分别表示要求对使用该海峡的船只收取过境费,如果正式确定,这将是能源成本的永久地缘政治最低标准。
- 市场已经开始从增长和技术敞口转向能源和国防企业,这反映了人们的观点,即石油价格上涨正在成为结构性成本,而不是暂时的风险溢价。
世界上最关键的石油阻塞点
霍尔木兹海峡每天处理大约2000万桶石油和石油产品,相当于全球石油消费量的20%和全球海运石油贸易的30%左右。由于全球石油需求接近1.04亿桶/日,且剩余产能有限,在最近的升级之前,市场已经处于紧密平衡状态。
该海峡也是液化天然气的重要走廊。2024年,平均每天约有2.9亿立方米的液化天然气通过该路线,约占全球液化天然气贸易的20%,亚洲市场是主要目的地。
国际能源署(IEA)将霍尔木兹描述为世界上最重要的石油运输阻塞点,并指出,即使是部分中断也可能引发价格的大幅波动。布伦特原油已跌破每桶100美元,这既反映了物质紧张,也反映了地缘政治风险溢价的上升。
由于流量减慢,油轮处于空转状态
现在,航运和保险数据实时显示压力。据报道,超过85艘大型原油运输船滞留在波斯湾,而由于运营商重新评估安全和保险,有150多艘船舶停泊、改道或延误。据估计,这将使1.2亿至1.5亿桶原油在海上闲置。
这些量仅代表霍尔木兹正常吞吐量的六到七天,或略高于一天的全球石油消费。
最新的航运和保险数据现在证实,有150多艘船只停泊、改道或延误,高于最初报告的85艘船只。闲置原油的1.3天全球消费保障仍然是约束性制约因素:这是流量冲击,不是储存问题,停火尚未转化为产量的实质性恢复。
建立在流量而不是存储基础上的市场
石油市场在持续波动中运作。炼油厂、石化厂和全球供应链经过调整,可以沿着可预测的海道稳定交付。当流经占全球石油消耗量约五分之一和全球海运石油贸易约30%的阻塞点时,该系统可以在几天之内从平衡变为赤字。
剩余产能主要集中在欧佩克内,估计仅为每天300万至500万桶。这远低于霍尔木兹水流受到严重干扰时面临的风险交易量。
Oil market analysis
How long do idle tankers last?
135M idle barrels — days of cover against each demand benchmark

vs. Strait of Hormuz daily flow (20M bbl/day)
vs. Global oil consumption (104M bbl/day)
vs. US Strategic Petroleum Reserve release (1M bbl/day)
135M
idle barrels on tankers (midpoint of 120–150M range)
~33%
of daily Hormuz flow that is idle storage, not transit
<31 hrs
is all idle storage against global daily consumption
通货膨胀风险和宏观溢出效应
石油冲击的通货膨胀影响通常以波浪形式出现。随着汽油、柴油和电力成本的上涨,燃料和能源价格的上涨可能会迅速提振总体通货膨胀。
随着时间的推移,更高的能源成本可能会流向货运、食品、制造业和服务业。如果混乱持续下去,通货膨胀率上升和增长放缓相结合,可能会增加滞胀环境的风险,使中央银行面临艰难的权衡。
不容易抵消,系统几乎没有松弛
当前局势之所以特别严重,是因为全球体系缺乏松弛。
当处理近2,000万桶/日(约占全球石油消耗量的五分之一)的阻塞点受到损害时,将近1.03亿至1.04亿桶的全球供需几乎没有备用缓冲。估计每天300万至500万桶的剩余产能,主要在欧佩克内部,只能覆盖风险产量的一小部分。
替代路线,包括绕过霍尔木兹的管道和改道运输,只能部分抵消流量的损失,而且通常成本更高,交货时间更长。
底线
在霍尔木兹海峡的过境恢复并被视为可靠安全之前,全球石油流动可能继续受损,风险溢价上升。对于投资者、政策制定者和企业决策者来说,核心问题是石油能否每天不间断地转移到需要去的地方。

The information provided is of general nature only and does not take into account your personal objectives, financial situations or needs. Before acting on any information provided, you should consider whether the information is suitable for you and your personal circumstances and if necessary, seek appropriate professional advice. All opinions, conclusions, forecasts or recommendations are reasonably held at the time of compilation but are subject to change without notice. Past performance is not an indication of future performance. Go Markets Pty Ltd, ABN 85 081 864 039, AFSL 254963 is a CFD issuer, and trading carries significant risks and is not suitable for everyone. You do not own or have any interest in the rights to the underlying assets. You should consider the appropriateness by reviewing our TMD, FSG, PDS and other CFD legal documents to ensure you understand the risks before you invest in CFDs.